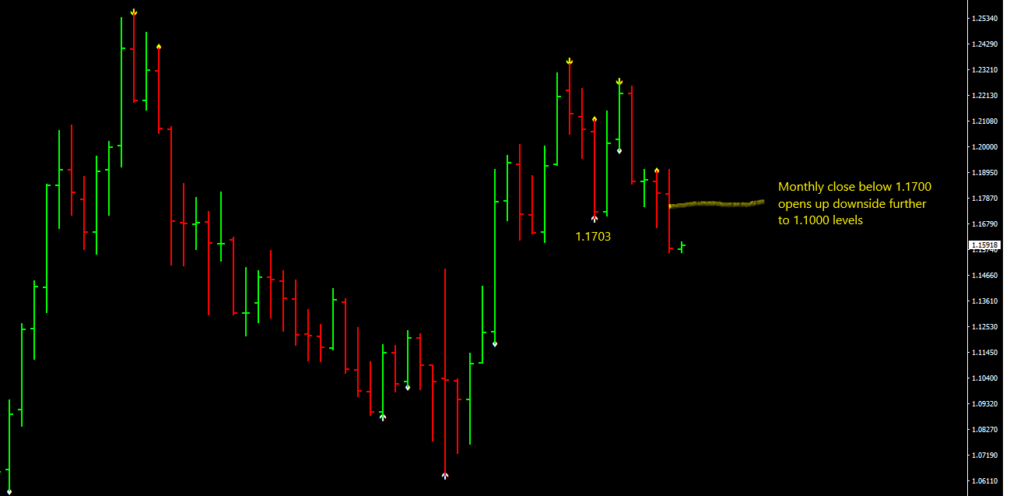
In last week’s EUR/USD price analysis, we mentioned how the weekly price action was favoring a move to 1.1360. We also pointed out how the Daily charts, provided it’s first clue that a change in trend was coming, with closes below 1.1725. This past week saw the beginning on such movement. Selling pressure started right at the opening session in Sydney with a high of 1.1725. The weekly low occurred in NY at 1.1565, while closing the session at 1.1595. Last week, we also referenced the Monthly chart projecting a move to 1.0990. This longer term forecast becomes even more apparent with the September close below 1.1703. Please see the monthly chart below for clarification.
The last two daily sessions bottomed at 1.1560 and traders who bought dips will be using that for their initial stops. If the initial bottom holds at 1.1560, then we should trade up to 1.1670-80 before running into resistance. If this initial support at 1.1560 breaks, 1.1485-95 should be the next key level where buyers will appear.

