Last week the US Dollar weakened against all the major pairs, with the exception of the Yen. The Yen weakness was evident across the board with USDJPY advancing to it’s highest level in three years at 114.45. The weekly momentum in this pair seems likely to break the Oct 2018 highs of 114.54. The Yen also weakened against the other major pairs, including the Euro, Sterling, Swiss Franc, Canadian dollar, Aussie dollar and Kiwi.
In this upcoming week, we are looking at the following price levels to indicate where the next trade will come from.
The daily chart shows a bottom to top projection for EUR/USD coming in at the 1.1665 level. Whilst this trend is still in a negative posture, any daily closes above 1.1640 could flip the trend upwards. Be mindful in this pair though, we show initial weekly and monthly dynamic resistance coming at the 1.1665/75 zone. A scenario could play out where we break above 1.1645 to clear out the weaker stop loss orders. This price action could extend to 1.1665/75, however unless we see a close above 1.1640, be cautious of new longs.
Sterling continues to show it’s desire to venture on it’s own. The GBP/USD has already extended beyond it’s daily bottom to top trend projections with more upside potential to 1.3838. The weekly chart for this pair confirmed a medium term bottom with Friday’s close in NY at 1.3742. The weekly trend, while just two weeks ago showed the desire to open to the downside, could signal otherwise. While it still appears that Sterling is searching for a short term top and 1.3800 will be the weekly level to break. There is potential for the weekly GBP/USD to extend upwards to 1.4537. This potential move higher would push it beyond the highs made in April 2018 at 1.4375.
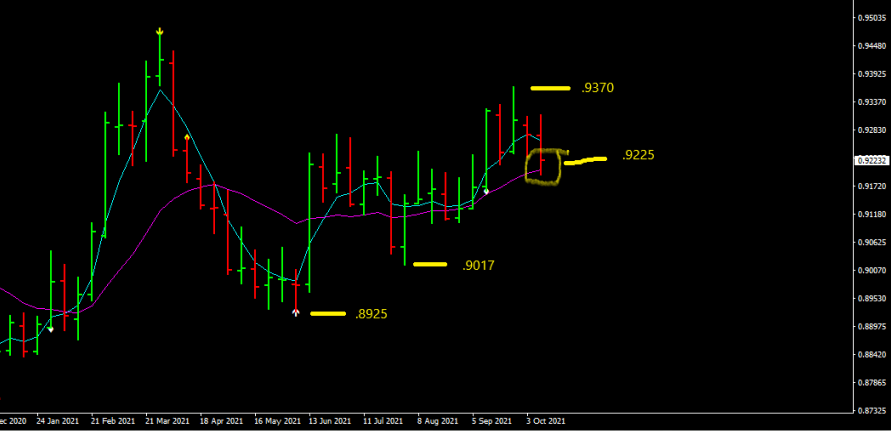
Dollar Swiss, USD/CHF, confirmed a lower weekly top on Friday’s NY close at .9225. This sets the stage for a move to .9020 and then .8925. Any weekly close below .9015 should propel USD/CHF lower below the .8925 area. Initial weekly dynamic support comes in at .9175/85. Look at 4 hour closes to provide initial direction for this pair with closes above .9240 or below .9210 to dictate.

Dollar Yen, USD/JPY, has clearly been a market standout. Yen weakness versus both the USD along with all other majors has dominated. All three trends, daily, weekly and monthly, point in the upwards direction with no top in sight yet for USD/JPY. The weekly levels to watch come in at 115.55/65 on the upside and 112.95/05 on the downside.
Dollar Canada, USD/CAD, made another consecutive weekly lower low and close at 1.2360. In last weeks report, we revealed a change in trend lower on the daily chart. This was also in coordination with a weekly trend which projects to 1.1800 in the medium term. We did believe there was a short term opportunity in the 1.2425 area for a rally to 1.2600, but that was short lived with more selling arriving at 1.2480. For this week, we see initial dynamic support at 1.2255/65 and dynamic resistance at 1.2450/60.
Last week AUD/USD finally got a daily close above .7316 to turn the trend upwards. Once this occurred, we got further upside momentum with a weekly high at .7439 and close of .7415. The next major level to propel this pair higher would be a weekly close above .7480. The weekly dynamic resistance comes in at .7465/75 and dynamic support at .7365/55. Traders should be cautious if new weekly highs occur and we are not able to get the desired close above .7480.
The Kiwi, NZD/USD, confirmed a higher low on the weekly charts at .7072. This puts into question if the prior daily retracement which is projected to advance further still to .7112 will pick up more momentum. Our thoughts are that sellers will emerge at the dynamic resistance level of .7095/7105 and then again at .7120/30. Initial dynamic support comes in at .7055/45.

Forex Forecasts – Weekly edition – October 24, 2021 - Proven Trader
[…] a holding pattern last week. While first making a run up initially to the dynamic resistance area we projected at 1.1665/75 with a high of 1.1668. This price action also fulfilled a bottom to top projection at 1.1665 […]